Gold in Correction Mode – What COT Data and Seasonality Really Tell Us
Gold Futures have declined sharply from their 2026 all-time highs. While headlines continue to promote monetary reset scenarios and extreme upside targets, the latest Commitments of Traders data tells a more disciplined story — and points to a specific window where the next high-probability long setup may form.
Gold remains in a long-term bullish trend, but short-term positioning and seasonality do not yet support a new aggressive long entry. Current classification: Bullish Trend – COT Caution / Seasonal Wait
Market Snapshot
| Indicator | Latest Value | Week-over-Week |
|---|---|---|
| Gold Futures | COMEX: GC | – |
| Latest Price | $4,096 | −3.52% |
| Commercial Net Position | −205,404 | +2,159 (slight covering) |
| Large Speculators Net Position | +181,339 | +1,119 |
| COT Index | 82% | +2% |
| Open Interest | 352,167 | +12,837 |
| OBV Trend | Falling | Unchanged |
| Buy Score | 3 / 10 | ↑ from 1 |
| Seasonal Trend | Bullish | – |
| Next Seasonal Long Window | July 19 – August 28 | – |
Reading the COT-Trader Dashboard
The first chart combines multiple positioning indicators into a single weekly dashboard: price action, Commercial positioning, Large Speculator exposure, Open Interest, On-Balance Volume and the proprietary COT-Trader Buy Score.
Rather than analysing one indicator in isolation, the objective is to understand whether price action, positioning and volume confirm the same market narrative. For Gold, the current dashboard shows a market that remains structurally bullish, but where Commercial hedgers still maintain unusually large short exposure while speculative positioning remains elevated.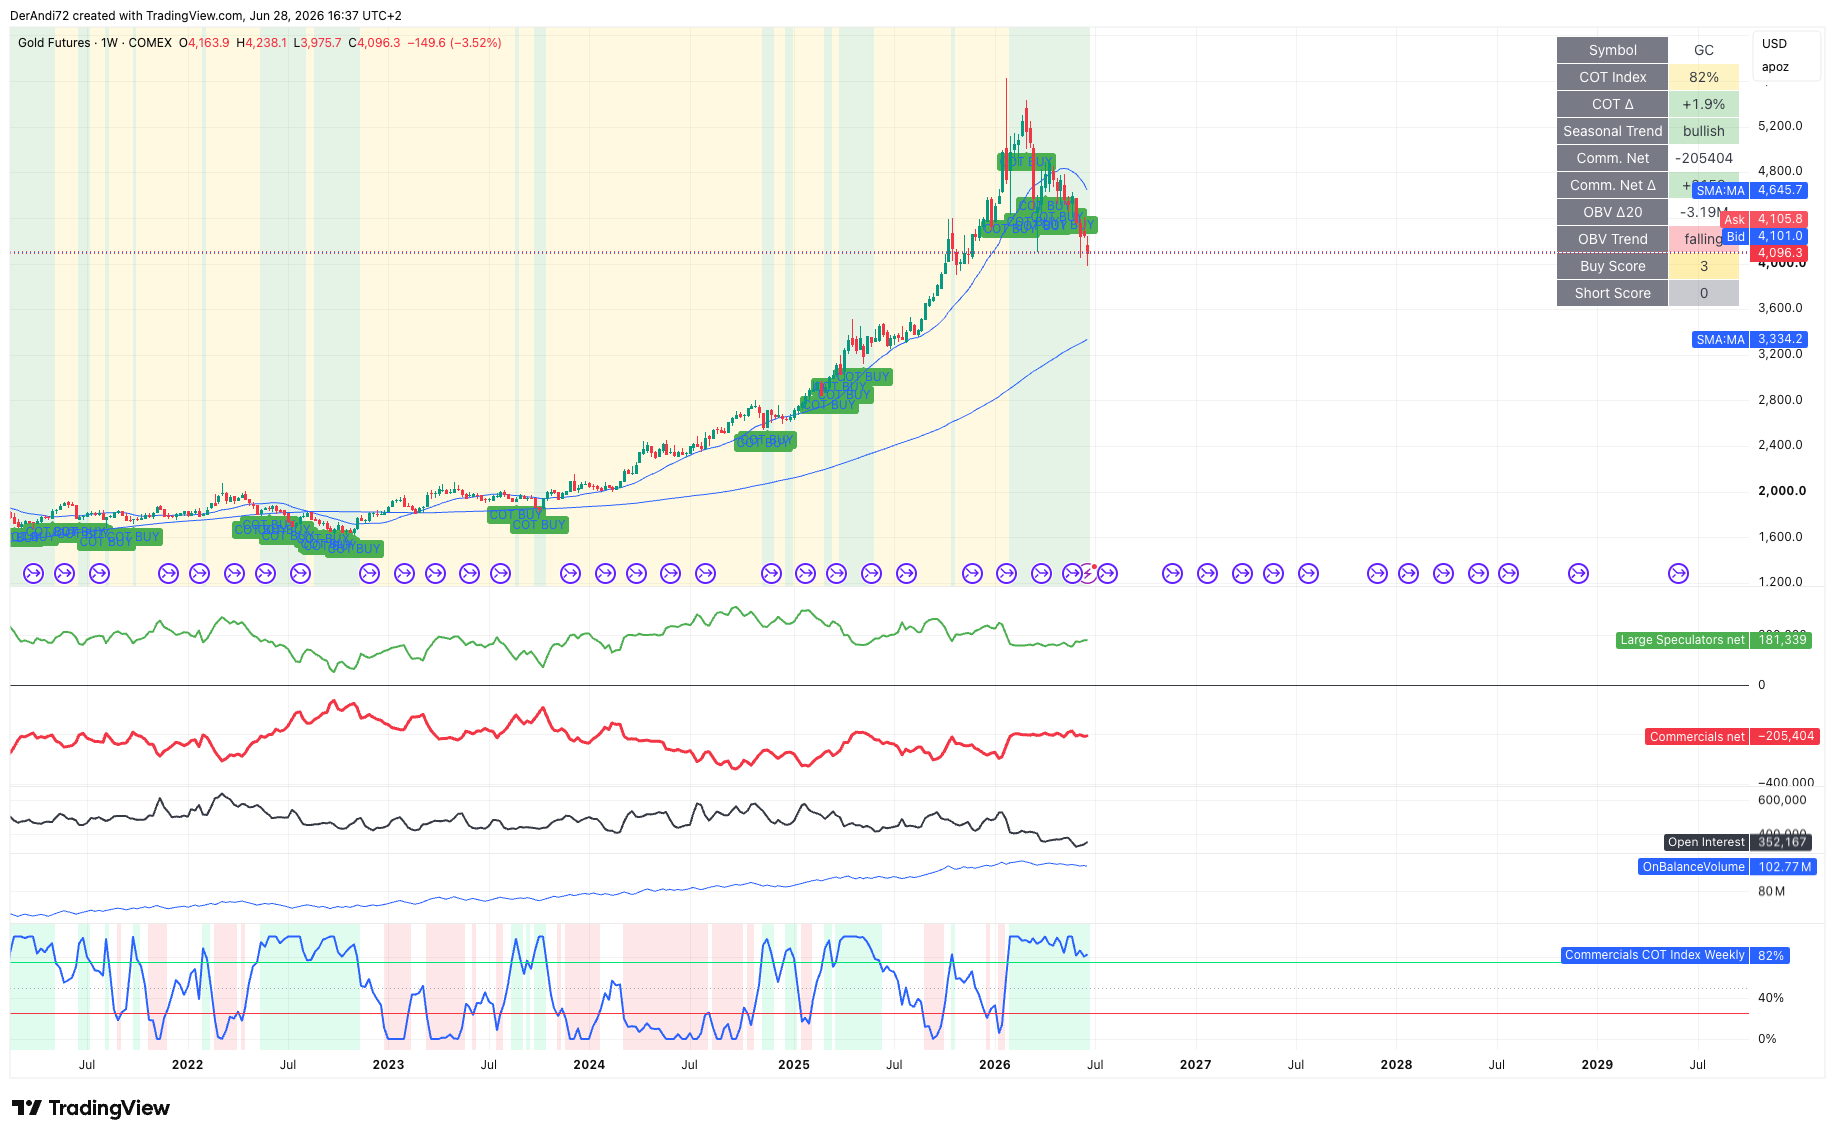
The Narrative vs. The Data
Gold has dominated financial media in 2026. Calls for $10,000, $20,000 or even a full monetary reset are circulating widely, often backed by references to Fed accounting manuals, sound-money policy advocates and historical bimetallic ratios.
These arguments make for compelling reading. But for traders who base decisions on positioning data, the question is always the same: what do the actual COT numbers say?
The latest CFTC data provides a clear answer: the long-term trend remains bullish, but positioning has not yet reset enough to support an aggressive new long entry.
What Changed in the Latest COT Report?
Commercial hedgers — the producers, refiners and institutional participants who use futures markets primarily to hedge physical exposure — reduced their net short position by approximately 2,159 contracts during the reporting week. This brings their net position from −207,563 to −205,404.
This is a modest move. At a COT Index of 82%, Commercial positioning is no longer in an attractive accumulation zone. In this context, the COT structure argues for caution rather than fresh aggressive longs.
Large Speculators added a further 1,119 contracts to their net long position, bringing their total to +181,339. Despite the correction from the all-time high, speculative money has not meaningfully exited. This divergence — prices falling while specs hold exposure — is worth monitoring closely.
Open Interest increased by 12,837 contracts during the week. Rising Open Interest alongside falling prices often suggests that new short exposure is entering the market, adding structural downside pressure.
The one clear positive in this week’s report is the Buy Score improvement from 1 to 3. This suggests early internal signals are beginning to turn. It is not yet a setup, but it is a signal worth tracking.
Trend vs. Positioning
The current market structure in Gold creates a familiar tension between long-term trend and short-term positioning risk.
Bullish Factors
- Long-term weekly uptrend structurally intact
- 200-week moving average rising (~$3,334)
- Bullish seasonal trend designation
- Modest Commercial covering this week
- Buy Score improving (1 → 3)
Risk Factors
- COT Index at 82% — not yet a clean accumulation setup
- Commercials still heavily net short (−205,404)
- Large Specs have not reduced exposure meaningfully
- Rising Open Interest with falling price
- OBV Trend remains falling
Seasonality: What the Calendar Shows
COT positioning data gains additional context when combined with seasonal analysis. The COT-Trader seasonality model for Gold Futures (GC1!, indexed geometric path, 10-year history 2016–2025) identifies two seasonal long windows per year.
Reading the Seasonality Model
The second chart illustrates the historical seasonal tendency using COT-Trader’s Indexed Geometric Path methodology. Rather than predicting exact prices, the model highlights recurring periods where Gold has historically shown above-average strength or weakness over the last ten years.
Current market behaviour can then be compared against the historical seasonal path to identify periods where positioning and seasonality begin to align.
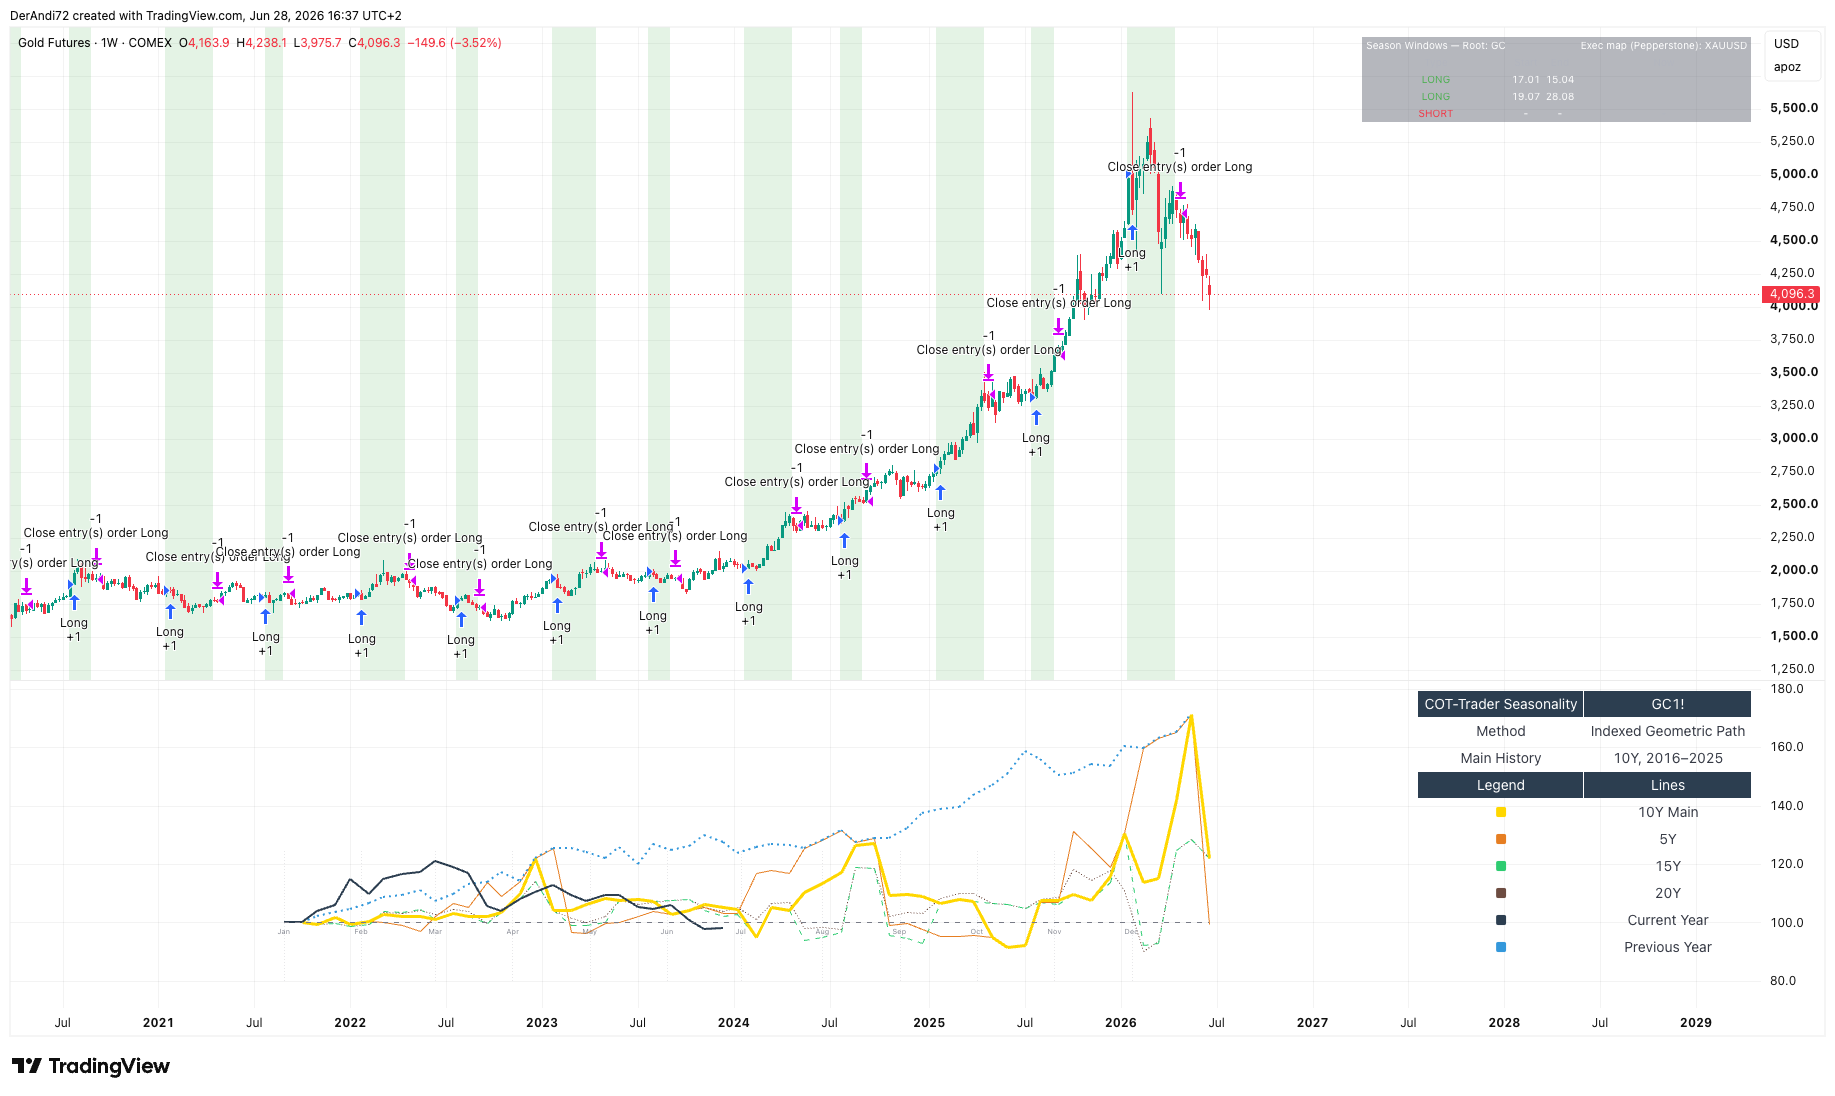
The first long window — January 17 to April 15 — has already expired. The 10-year median path shows that Gold typically enters a softer period from late April through mid-July before recovering into the second seasonal window.
The second seasonal long window opens on July 19 and runs through August 28. This is the date that matters most for traders currently watching from the sidelines.
Notably, the current year is tracking below the 10-year median through this period — consistent with the sharper-than-average correction observed since the recent peak.
The Setup to Watch: July 19
The convergence of seasonal timing and COT positioning creates a clear analytical framework for the coming weeks. The question is not whether Gold can eventually move higher — the long-term structure suggests it can. The question is whether the data supports acting on that view.
For a high-probability long setup to form ahead of the July 19 window, the following conditions should ideally be met:
- COT Index should pull back toward the 50–60% range, indicating more meaningful Commercial covering
- Commercial Net should show consistent weekly reductions in short exposure
- OBV Trend should stabilize or turn rising
- Large Specs should begin reducing net long exposure, confirming a positioning washout
- Buy Score should continue improving toward the 6–7 range
If these conditions align by mid-July, the seasonal long window becomes a stronger setup backed by both timing and positioning data. If the COT Index remains above 80% into July 19, the seasonal window alone is not sufficient justification for a long entry. Data leads — seasonality confirms.
COT-Trader View
Gold’s long-term bull market is not the issue. The structural trend remains intact, and the 200-week moving average continues to provide a rising foundation. But markets rarely move in straight lines, and the current data does not support aggressive long positioning at this stage.
The short-term picture is one of a market in distribution. Prices have corrected significantly, yet speculative longs remain elevated and Commercials continue to hedge aggressively. This combination typically resolves with further price weakness or an extended consolidation — precisely the kind of base from which the next seasonal long window can launch.
Bullish Trend – COT Caution / Seasonal Wait