WASDE April 2026: Wheat Turns Heavier, Corn Stays Neutral, Soy Complex Mixed
The USDA’s April 2026 WASDE report raised wheat stocks, left U.S. corn largely unchanged, and kept the soybean complex mixed with more support in meal and oil than in flat price beans.
Wheat
Higher U.S. and global ending stocks keep the tone heavy.
Corn
U.S. unchanged, but global stocks edged a little higher.
Soybeans
Higher crush was offset by lower exports.
Soybean Meal / Oil
The report was more supportive for products than for beans.
Cotton
Global production and ending stocks increased.
Sugar
Small changes, but no major shift in the core balance.
Wheat: the clearest bearish signal in the report
Wheat delivered the most obvious bearish shift in the April WASDE. The USDA raised 2025/26 U.S. wheat ending stocks to 938 million bushels, up from 931 million in March and now 10% above last year. That marks the largest U.S. wheat stocks level since 2019/20.
Imports were revised slightly higher, domestic use edged lower, and exports stayed unchanged at 900 million bushels. On the global side, the bearish tone was reinforced as world wheat ending stocks increased to 283.1 million metric tons.
From a trading perspective, wheat currently looks like the weakest market in this report. Unless weather risk becomes more severe, rallies may remain vulnerable to selling pressure.
Corn: U.S. unchanged, global tone a bit softer
Corn was much less dramatic. The 2025/26 U.S. corn balance sheet was left unchanged versus March. Feed and residual use stayed at 6.2 billion bushels, exports held at 3.3 billion bushels, and ending stocks remained at 2.127 billion bushels. The only notable U.S. revision was a small increase in the farm price outlook to $4.15/bu.
Globally, however, the picture softened slightly. World corn ending stocks rose to 294.8 million tons, which keeps the market from turning clearly bullish on this report alone.
For traders, that means corn stays mostly a weather-driven market. The WASDE itself was not bullish enough to justify aggressive upside, but not bearish enough to force a structural downside call either.
Soybeans: neutral in beans, stronger undertone in products
Soybeans were one of the more nuanced sections of the report. The USDA raised 2025/26 U.S. soybean crush to 2.61 billion bushels but lowered exports to 1.54 billion bushels. The net result was that ending stocks stayed unchanged at 350 million bushels.
The more interesting shift came in the products. The USDA raised the soybean meal price to $310/short ton and the soybean oil price to 59 cents/lb.
That leaves soybeans themselves in a largely neutral zone, while soybean meal and soybean oil look more constructive. In other words, the report was more supportive for the soy complex products than for flat price beans.
Cotton: slightly softer on higher global stocks
The U.S. cotton balance sheet itself was unchanged, but the global side leaned slightly bearish. World cotton production increased to 121.87 million bales, while ending stocks rose to 77.04 million bales.
This is not an extreme oversupply story, but it does make sustained bullish momentum harder unless outside macro drivers or weather concerns add fresh support.
Sugar: mostly neutral
Sugar remained comparatively quiet in this month’s report. U.S. ending stocks were effectively unchanged and the stocks-to-use ratio stayed near 15.2%.
For now, sugar still looks more influenced by outside factors such as energy, Brazil’s cane mix, and macro sentiment than by this month’s WASDE revisions alone.
Trader takeaway
The April 2026 WASDE was not a “buy everything” or “sell everything” report. It was a selective report:
- Wheat: bearish bias
- Corn: neutral / weather-dependent
- Soybeans: neutral
- Soybean Meal / Oil: constructive
- Cotton: slightly bearish
- Sugar: neutral
For active traders, wheat now looks like the clearest weak spot in the report, while corn remains a market to watch through the lens of planting progress and Corn Belt weather.

WASDE (Mar 10, 2026) — Full Report Trading Bias (WASDE-669)
Focus: What changed vs. last month, why it matters, and a practical directional bias for the key tradable markets (Futures + CFD mapping for Pepperstone / Capital.com).
Headline Bias Board
How to Read This
- Bullish = net tighter supply / stronger demand / price support (WASDE logic).
- Bearish = looser balance sheet / weaker demand / price headwind.
- Mixed = conflicting drivers; wait for price confirmation.
Practical Trading Note
March is often a confirmation month rather than a “shock month”. In WASDE-669, most U.S. balance sheets stayed unchanged, so relative strength and confirmation via price action matter more than trading the headline alone.
Trading Products & Symbol Mapping (Futures + CFDs)
Futures tickers below use the common TradingView continuous format (CBOT:ZC1! etc.). CFD symbols are what you’ll typically find directly in TradingView search for each broker (availability can vary by region/account).
| Market | Futures (CME/ICE) | TradingView Futures | Pepperstone (CFD) | Capital.com (CFD) |
|---|---|---|---|---|
| Wheat | CBOT Wheat ZW |
CBOT:ZW1! |
PEPPERSTONE:WHEAT |
CAPITALCOM:WHEAT |
| Corn | CBOT Corn ZC |
CBOT:ZC1! |
PEPPERSTONE:CORN |
CAPITALCOM:CORN |
| Soybeans | CBOT Soybeans ZS |
CBOT:ZS1! |
PEPPERSTONE:SOYBEANS |
CAPITALCOM:SOYBEAN |
| Soybean Meal | CBOT Meal ZM |
CBOT:ZM1! |
— (usually not offered) | CAPITALCOM:SOYBEANMEAL |
| Soybean Oil | CBOT Oil ZL |
CBOT:ZL1! |
— (usually not offered) | — (check availability) |
| Rough Rice | CBOT Rice ZR |
CBOT:ZR1! |
— | CAPITALCOM:RR |
| Cotton | ICE Cotton #2 CT |
ICEUS:CT1! |
PEPPERSTONE:COTTON |
CAPITALCOM:USCOTTON |
| Sugar | ICE Sugar #11 SB |
ICEUS:SB1! |
PEPPERSTONE:SUGAR |
CAPITALCOM:SB |
| Live Cattle | CME Live Cattle LE |
CME:LE1! |
PEPPERSTONE:CATTLE |
CAPITALCOM:LIVECATTLE |
| Feeder Cattle | CME Feeder GF |
CME:GF1! |
— | CAPITALCOM:FEEDERCATTLE |
| Lean Hogs | CME Hogs HE |
CME:HE1! |
— | CAPITALCOM:LEANHOGS |
Note: Availability can differ by jurisdiction and account settings. If a CFD ticker doesn’t resolve in TradingView, search your broker’s symbol list (some use different naming like “WHEATUSD” etc.).
February vs March — What Changed?
Quick month-over-month comparison for the core balance sheet items (Feb vs Mar columns inside WASDE-669 tables). This section follows the same structure as your February article and highlights where revisions actually occurred.
Corn (ZC)
- Production (mbu): 17,021 → 17,021 flat
- Exports (mbu): 3,300 → 3,300 flat
- Ending Stocks (mbu): 2,127 → 2,127 flat
- Farm Price ($/bu): 4.10 → 4.10 flat
Soybeans (ZS)
- Imports (mbu): 20 → 25 ▲ +5
- Crush (mbu): 2,570 → 2,575 ▲ +5
- Ending Stocks (mbu): 350 → 350 flat
- Farm Price ($/bu): 10.20 → 10.20 flat
Wheat (ZW)
- Production (mbu): 1,985 → 1,985 flat
- Exports (mbu): 900 → 900 flat
- Ending Stocks (mbu): 931 → 931 flat
- Farm Price ($/bu): 4.90 → 4.95 ▲ +0.05
Trader takeaway: March is another “small revision” month. U.S. Corn is unchanged, Wheat only gets a modest farm-price lift, and Soybeans see a small increase in imports and crush but no change in ending stocks. The cleaner signals this month come more from the global tables than the U.S. headline numbers.
Post-WASDE Confirmation — Grain Complex Relative Performance
The chart below compares the percentage performance of Corn, Soybeans and Wheat around the March WASDE release. This is the fastest way to validate whether the balance-sheet narrative translates into real flows.
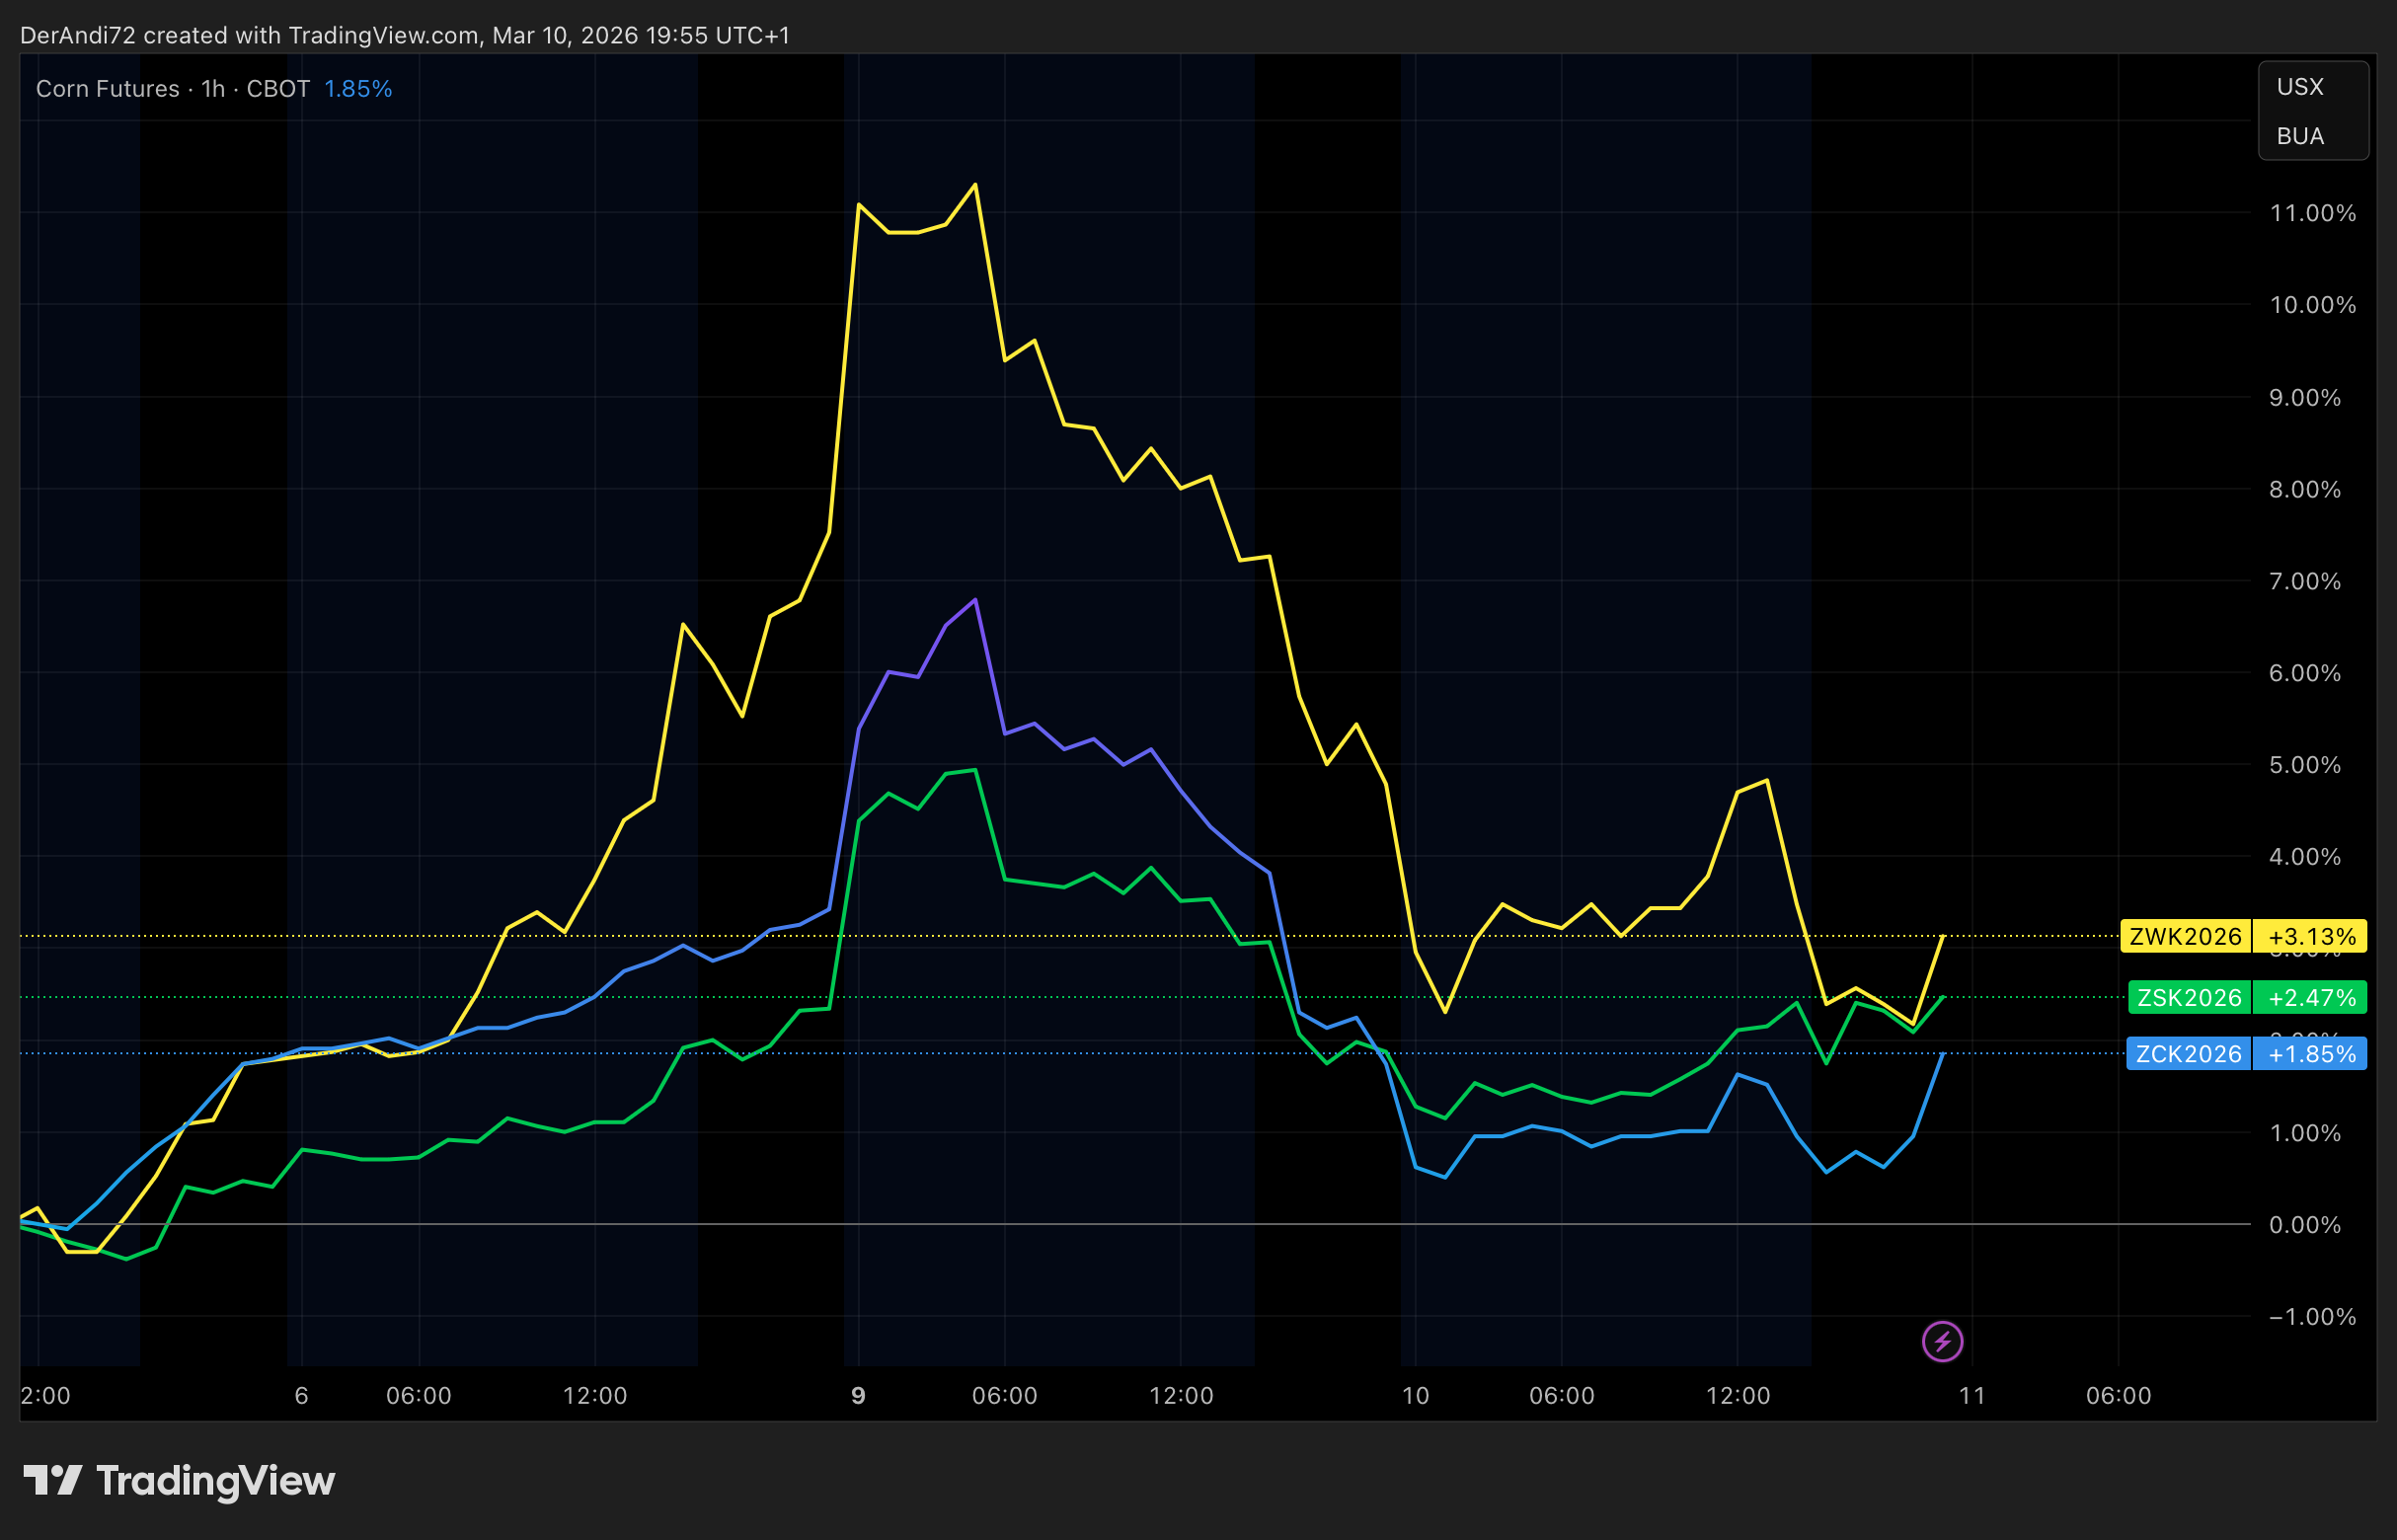
- Corn staying flat = unchanged U.S. balance sheet, no fresh tightening signal.
- Soybeans lagging = global South America supply still caps upside despite unchanged U.S. ending stocks.
- Wheat stability = modest support from stronger global consumption and a small farm-price increase.
Wheat — Neutral ▶
What changed (U.S.)
- Production: 1,985 mbu (unchanged)
- Exports: 900 mbu (unchanged)
- Ending stocks: 931 mbu (unchanged)
- Farm price: $4.90 → $4.95/bu
Global angle
- Production: 841.80 → 842.12 Mt
- Consumption: 824.06 → 824.80 Mt
- Ending stocks: 277.51 → 276.96 Mt
Trading interpretation
March is slightly supportive for Wheat on the global side, but the U.S. balance sheet is unchanged and world ending stocks remain a 5-year high. That keeps the overall read neutral rather than outright bullish.
Trading Products: CBOT:ZW1! • PEPPERSTONE:WHEAT • CAPITALCOM:WHEAT
Corn — Neutral ▶
What changed (U.S.)
- Production: 17,021 mbu (unchanged)
- Exports: 3,300 mbu (unchanged)
- Ending stocks: 2,127 mbu (unchanged)
- Farm price: $4.10/bu (unchanged)
Global angle
- World corn production: 1,295.91 → 1,297.44 Mt
- World ending stocks: 288.98 → 292.75 Mt
- Key drivers: Brazil +1.0 Mt, Ukraine +1.7 Mt, Argentina −1.0 Mt
Trading interpretation
The U.S. sheet is unchanged, but globally this is a slightly looser corn report. Higher world production and ending stocks offset the supportive February tightening story. That keeps Corn neutral this month rather than bullish.
Trading Products: CBOT:ZC1! • PEPPERSTONE:CORN • CAPITALCOM:CORN
Soybeans — Bearish ▼
What changed (U.S.)
- Imports: 20 → 25 mbu
- Crush: 2,570 → 2,575 mbu
- Ending stocks: 350 mbu (unchanged)
- Farm price: $10.20/bu (unchanged)
Global angle
- World production: 428.18 → 427.18 Mt
- World exports: 187.57 → 187.17 Mt
- World ending stocks: 125.51 → 125.31 Mt
Trading interpretation
Even though global soybean stocks were trimmed slightly, the bigger story remains the same: Brazil keeps the export anchor and Argentina is still large enough to cap upside. U.S. ending stocks did not tighten, so the structural soybean view stays bearish.
Trading Products: CBOT:ZS1! • PEPPERSTONE:SOYBEANS • CAPITALCOM:SOYBEAN
Optional: CBOT:ZM1! / CAPITALCOM:SOYBEANMEAL
Rice — Neutral ▶
What changed (U.S.)
- Imports: 47.7 → 45.7 million cwt
- Exports: 87.0 → 85.0 million cwt
- Ending stocks: 50.3 → 50.3 million cwt
- Average farm price: unchanged at $12.10/cwt (total rice)
Trading interpretation
Rice softens on trade flow, but because lower imports are fully offset by lower exports, ending stocks do not change. That makes the March message more neutral than outright bearish.
Trading Products: CBOT:ZR1! • CAPITALCOM:RR (Pepperstone typically n/a)
Cotton — Neutral ▶
What changed (U.S.)
- Production: 13.92 million bales (unchanged)
- Exports: 12.00 million bales (unchanged)
- Ending stocks: 4.40 million bales (unchanged)
- Farm price: 60.0 c/lb (unchanged)
Global angle
- World production: 119.86 → 120.99 million bales
- World use: 118.72 → 118.58 million bales
- World ending stocks: 75.11 → 76.39 million bales
Trading interpretation
The U.S. balance sheet is unchanged, but the world sheet is looser: production rises, use slips a little, and ending stocks move higher. That is enough to remove a bullish case, but not enough for a strong bearish call, so neutral fits best.
Trading Products: ICEUS:CT1! • PEPPERSTONE:COTTON • CAPITALCOM:USCOTTON
Sugar — Bullish ▲
What changed (U.S.)
- Production: 9,410 → 9,280 STRV
- Imports: 2,243 → 2,427 STRV
- Food deliveries: 12,048 → 12,165 STRV
- Ending stocks: 1,940 → 1,878 STRV
- Stocks-to-use: 15.89% → 15.24%
Trading interpretation
This is the cleanest bullish revision in the report: even with higher imports, stronger human consumption pulls ending stocks down and tightens the stocks-to-use ratio. That keeps Sugar as the strongest bullish WASDE read this month.
Trading Products: ICEUS:SB1! • PEPPERSTONE:SUGAR • CAPITALCOM:SB
Livestock & Dairy — Supply Up / Prices Mixed
What changed (2026)
- Beef production: 25,987 → 25,877 million lbs (lower)
- Pork production: 28,289 → 28,289 million lbs (unchanged)
- Total red meat production: 54,444 → 54,332 million lbs (slightly lower)
- Broiler production: 47,981 → 48,179 million lbs (higher)
The text of the report points to higher broiler production more than offsetting lower beef and turkey. Broader protein supply remains ample, even if red meat alone was trimmed slightly in the detailed table. For trading purposes, the overall meat complex still reads as a supply-heavy backdrop.
Trading Products: CME:LE1! / PEPPERSTONE:CATTLE / CAPITALCOM:LIVECATTLE
Optional: CME:GF1! / CAPITALCOM:FEEDERCATTLE • CME:HE1! / CAPITALCOM:LEANHOGS
What changed (2026 prices)
- Class III: 16.65 → 16.65 (unchanged)
- Class IV: 15.70 → 17.15 (raised)
- All Milk: 18.95 → 19.70/cwt (raised)
Milk production is slightly higher, but stronger butter and NDM pricing lift Class IV and the all-milk price forecast. That is constructive, but because production also increased, a neutral-to-constructive dairy read is more balanced than a full bullish call.
Day-0 Execution Checklist (WASDE Day)
- Expect spikes: reduce size or widen stops if you trade the release window.
- Trade confirmation: let the first impulse print, then take continuation/reclaim setups.
- Use the complex: Corn vs Beans often gives cleaner relative-value signals than outright.
- Re-entry rule: if stopped by volatility, prefer a rule-based trigger (reclaim range / break & hold).
WASDE (Feb 10, 2026) — Full Report Trading Bias (WASDE-668)
Focus: What changed vs. last month, why it matters, and a practical directional bias for the key tradable markets (Futures + CFD mapping for Pepperstone / Capital.com).
Headline Bias Board
How to Read This
- Bullish = net tighter supply / stronger demand / price support (WASDE logic).
- Bearish = looser balance sheet / weaker demand / price headwind.
- Mixed = conflicting drivers; wait for price confirmation.
Practical Trading Note
February is often a confirmation month rather than a “shock month”. If the balance-sheet changes are small, price may react first (knee-jerk) and only trend later if flows confirm. Use the grain-complex relative performance chart below to validate the narrative.
Trading Products & Symbol Mapping (Futures + CFDs)
Futures tickers below use the common TradingView continuous format (CBOT:ZC1! etc.). CFD symbols are what you’ll typically find directly in TradingView search for each broker (availability can vary by region/account).
| Market | Futures (CME/ICE) | TradingView Futures | Pepperstone (CFD) | Capital.com (CFD) |
|---|---|---|---|---|
| Wheat | CBOT Wheat ZW |
CBOT:ZW1! |
PEPPERSTONE:WHEAT |
CAPITALCOM:WHEAT |
| Corn | CBOT Corn ZC |
CBOT:ZC1! |
PEPPERSTONE:CORN |
CAPITALCOM:CORN |
| Soybeans | CBOT Soybeans ZS |
CBOT:ZS1! |
PEPPERSTONE:SOYBEANS |
CAPITALCOM:SOYBEAN |
| Soybean Meal | CBOT Meal ZM |
CBOT:ZM1! |
— (usually not offered) | CAPITALCOM:SOYBEANMEAL |
| Soybean Oil | CBOT Oil ZL |
CBOT:ZL1! |
— (usually not offered) | — (check availability) |
| Rough Rice | CBOT Rice ZR |
CBOT:ZR1! |
— | CAPITALCOM:RR |
| Cotton | ICE Cotton #2 CT |
ICEUS:CT1! |
PEPPERSTONE:COTTON |
CAPITALCOM:USCOTTON |
| Sugar | ICE Sugar #11 SB |
ICEUS:SB1! |
PEPPERSTONE:SUGAR |
CAPITALCOM:SB |
| Live Cattle | CME Live Cattle LE |
CME:LE1! |
PEPPERSTONE:CATTLE |
CAPITALCOM:LIVECATTLE |
| Feeder Cattle | CME Feeder GF |
CME:GF1! |
— | CAPITALCOM:FEEDERCATTLE |
| Lean Hogs | CME Hogs HE |
CME:HE1! |
— | CAPITALCOM:LEANHOGS |
Note: Availability can differ by jurisdiction and account settings. If a CFD ticker doesn’t resolve in TradingView, search your broker’s symbol list (some use different naming like “WHEATUSD” etc.).
January vs February — What Changed?
Quick month-over-month comparison for the core balance sheet items (Jan vs Feb columns inside WASDE-668 tables). This section is designed to be repeated every month throughout 2026.
Corn (ZC)
- Production (mbu): 17,021 → 17,021 flat
- Exports (mbu): 3,200 → 3,300 ▲ +100
- Ending Stocks (mbu): 2,227 → 2,127 ▼ −100
- Farm Price ($/bu): 4.10 → 4.10 flat
Soybeans (ZS)
- Production (mbu): 4,262 → 4,262 flat
- Exports (mbu): 1,575 → 1,575 flat
- Ending Stocks (mbu): 350 → 350 flat
- Farm Price ($/bu): 10.20 → 10.20 flat
Wheat (ZW)
- Production (mbu): 1,985 → 1,985 flat
- Exports (mbu): 900 → 900 flat
- Ending Stocks (mbu): 926 → 931 ▲ +5
- Farm Price ($/bu): 4.90 → 4.90 flat
Trader takeaway: February is a “small revision” month — Corn is the clean standout (exports up + ending stocks down), while Soybeans are unchanged and Wheat is slightly looser on ending stocks. Use confirmation via price/relative strength rather than trading headlines.
Post-WASDE Confirmation — Grain Complex Relative Performance
The chart below compares the percentage performance of Corn, Soybeans and Wheat around the February WASDE release. This is the fastest way to validate whether the balance-sheet narrative translates into real flows.
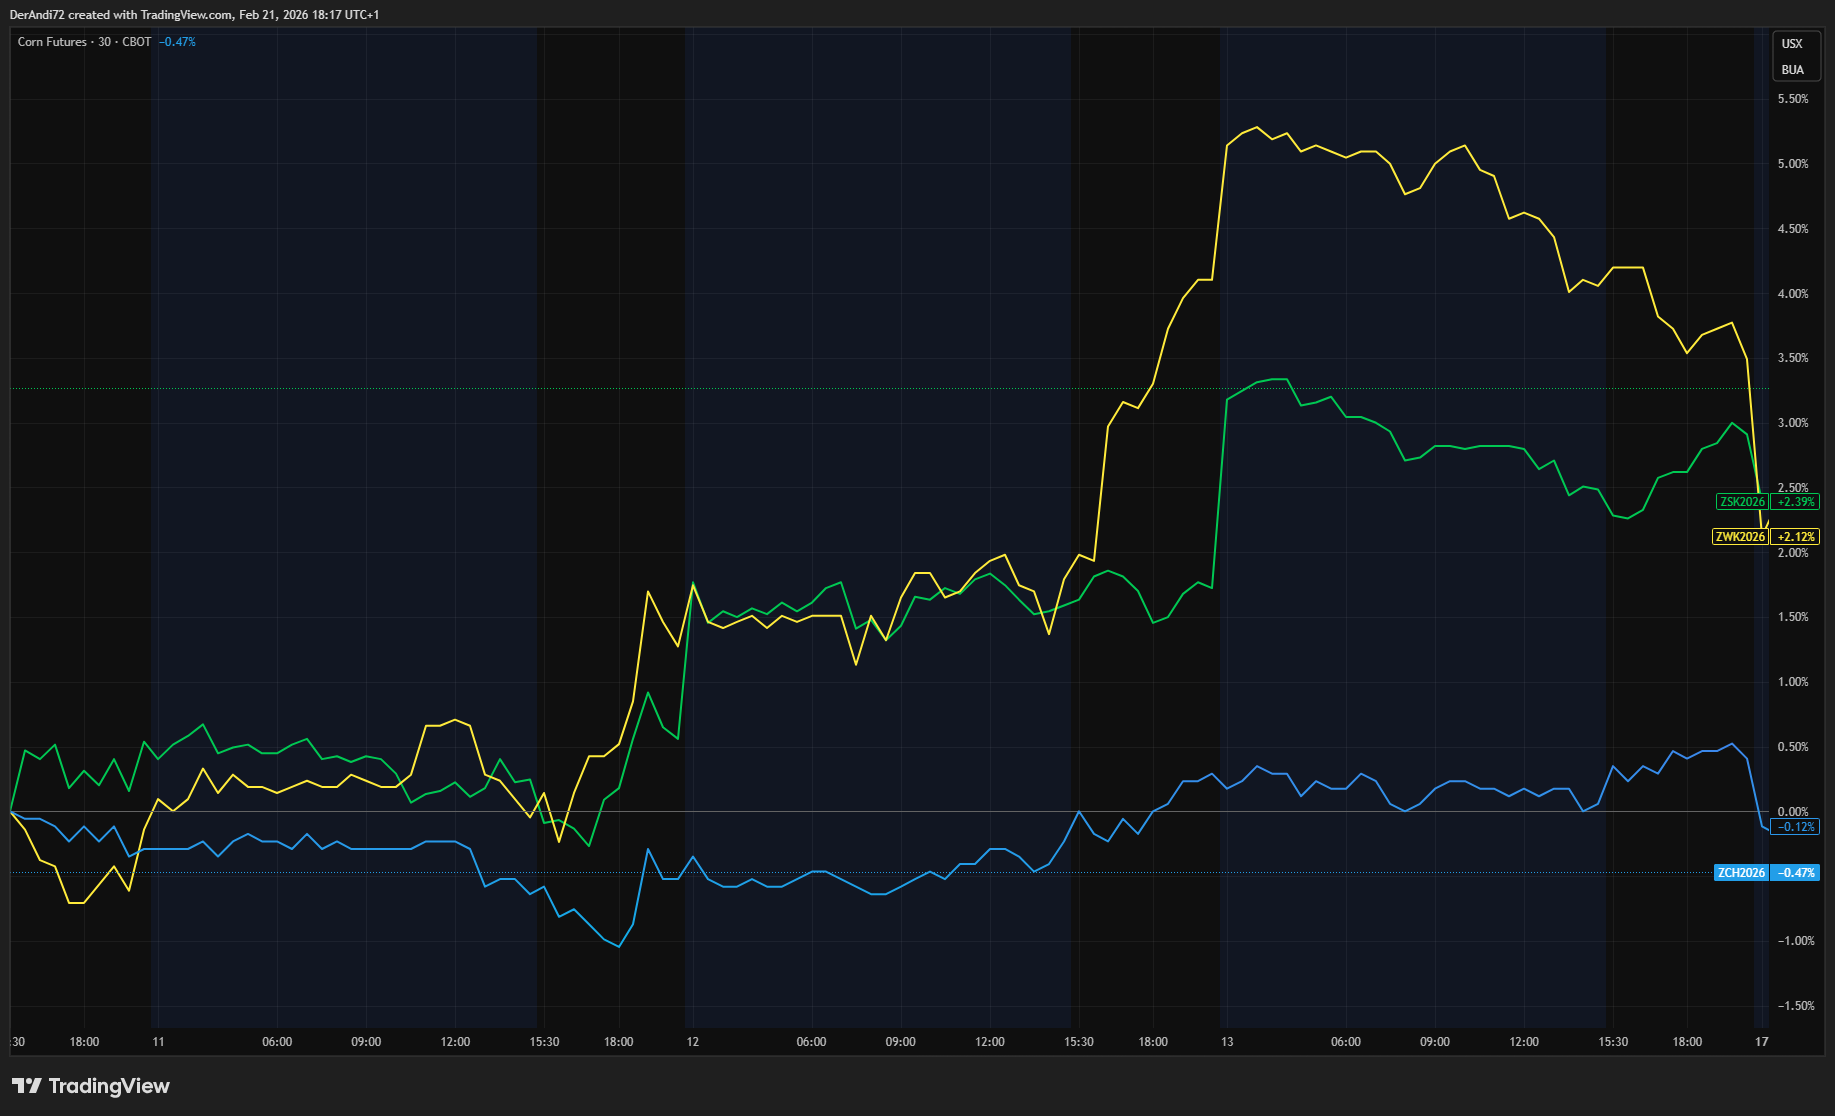
- Corn outperformance = tightening confirmed (exports up, stocks down).
- Soybeans drifting/lagging = “unchanged WASDE” market waits for South America + demand signals.
- Wheat stability = neutral balance sheet; price tends to trade correlation & risk headlines.
Wheat — Neutral ▶
What changed (U.S.)
- Ending stocks: 926 → 931 mbu (slightly higher)
- Exports: 900 mbu (unchanged)
- Domestic use: 1,133 → 1,128 mbu (slightly lower)
- Farm price: $4.90/bu (unchanged)
Trading interpretation
February is not adding new conviction to Wheat. With exports flat and ending stocks slightly higher, Wheat often trades off complex correlation (Corn) and risk headlines rather than WASDE itself. Prefer price confirmation (break/hold) over “report guessing”.
Trading Products: CBOT:ZW1! • PEPPERSTONE:WHEAT • CAPITALCOM:WHEAT
Corn — Bullish ▲
What changed (U.S.)
- Production: 17,021 mbu (unchanged)
- Exports: 3,200 → 3,300 mbu
- Ending stocks: 2,227 → 2,127 mbu
- Farm price: $4.10/bu (unchanged)
Trading interpretation
- This is a clean “tightening” revision: higher exports + lower ending stocks.
- Don’t chase the first candle — best entries often come from reclaim/continuation after the initial spike.
- Risk control idea: invalidation below the WASDE-day low or ~1×ATR below the trigger.
Trading Products: CBOT:ZC1! • PEPPERSTONE:CORN • CAPITALCOM:CORN
Soybeans — Mixed ▶
What changed (U.S.)
- Production: 4,262 mbu (unchanged)
- Exports: 1,575 mbu (unchanged)
- Ending stocks: 350 mbu (unchanged)
- Farm price: $10.20/bu (unchanged)
Trading interpretation
When WASDE is “unchanged”, Soybeans often trade more off South America weather/harvest, export pace, and meal/oil dynamics. In that environment, the higher-quality trade is frequently relative-value inside the grain complex (e.g., Corn strength vs Beans).
Trading Products: CBOT:ZS1! • PEPPERSTONE:SOYBEANS • CAPITALCOM:SOYBEAN
Optional: CBOT:ZM1! / CAPITALCOM:SOYBEANMEAL
Rice — Bearish ▼
What changed (U.S.)
- Imports: 48.7 → 47.7 million cwt (−1.0)
- Exports: 89.0 → 87.0 million cwt (−2.0)
- Ending stocks: 49.3 → 50.3 million cwt (+1.0)
- Farm price: $11.80 → $12.10/cwt (+0.30)
Trading interpretation
Softer exports and higher ending stocks are a balance-sheet headwind. Rice can be thinner/liquidity-sensitive — treat it as a “planning market” unless you have a clear technical trigger.
Trading Products: CBOT:ZR1! • CAPITALCOM:RR (Pepperstone typically n/a)
Cotton — Bearish ▼
What changed (U.S.)
- Exports (million bales): 12.20 → 12.00 (−0.20)
- Ending stocks (million bales): 4.20 → 4.40 (+0.20)
- Upland farm price: 61.0 → 60.0 cents/lb (−1)
- Production: 13.92 million bales (unchanged)
Trading interpretation
A classic “demand softness” revision: exports trimmed, stocks rise, price forecast slips. Cotton can trend hard — avoid chasing the first move and respect ATR sizing.
Trading Products: ICEUS:CT1! • PEPPERSTONE:COTTON • CAPITALCOM:USCOTTON
Sugar — Mixed ▶
What changed (U.S.)
- Production (1,000 STRV): 9,381 → 9,410 (+29)
- Imports (1,000 STRV): 2,255 → 2,243 (−12)
- Ending stocks (1,000 STRV): 1,922 → 1,940 (+18)
- Stocks-to-use: 15.8% → 15.9% (slightly looser)
Trading interpretation
The U.S. balance sheet is still relatively tight, but February is marginally looser (ending stocks up). Sugar is heavily influenced by macro and FX (especially BRL) — treat WASDE as one input, not the whole story.
Trading Products: ICEUS:SB1! • PEPPERSTONE:SUGAR • CAPITALCOM:SB
Livestock & Dairy — Supply Up / Prices Up (Two-Speed)
What changed (2026)
- Beef production: 25,802 → 25,987 million lbs (higher)
- Pork production: 28,229 → 28,289 million lbs (higher)
- Total red meat production: 54,198 → 54,444 million lbs (higher)
More supply is generally a headwind unless demand surprises. In practice, cattle/hogs can still trend, but WASDE revisions point to a “supply up” backdrop.
Trading Products: CME:LE1! / PEPPERSTONE:CATTLE / CAPITALCOM:LIVECATTLE
Optional: CME:GF1! / CAPITALCOM:FEEDERCATTLE • CME:HE1! / CAPITALCOM:LEANHOGS
What changed (2026 prices)
- All Milk price: $18.25 → $18.95/cwt (raised)
- Class III: $16.35 → $16.65/cwt (raised)
- Class IV: $14.45 → $15.70/cwt (raised)
This is price-supportive for the dairy complex: product prices and class prices revised higher. If you trade dairy proxies, treat this as a constructive macro tailwind.
Day-0 Execution Checklist (WASDE Day)
- Expect spikes: reduce size or widen stops if you trade the release window.
- Trade confirmation: let the first impulse print, then take continuation/reclaim setups.
- Use the complex: Corn vs Beans often gives cleaner relative-value signals than outright.
- Re-entry rule: if stopped by volatility, prefer a rule-based trigger (reclaim range / break & hold).
WASDE (Jan 12, 2026) — Full Report Trading Bias (WASDE-667)
Focus: What changed vs. last month, why it matters, and a practical directional bias for the key tradable markets (Futures + CFD mapping for Pepperstone / Capital.com).
Headline Bias Board
How to Read This
- Bullish = net tighter supply / stronger demand / price support (WASDE logic).
- Bearish = looser balance sheet / weaker demand / price headwind.
- Mixed = conflicting drivers; wait for price confirmation.
Practical Trading Note
WASDE often triggers a knee-jerk move first, and then a trend only if the balance-sheet change is meaningful. For seasonal trading: treat WASDE day as a volatility spike — re-entries should be conditional (see Wheat section).
Trading Products & Symbol Mapping (Futures + CFDs)
Futures tickers below use the common TradingView continuous format (CBOT:ZC1! etc.). CFD symbols are what you’ll typically find directly in TradingView search for each broker (availability can vary by region/account).
| Market | Futures (CME/ICE) | TradingView Futures | Pepperstone (CFD) | Capital.com (CFD) |
|---|---|---|---|---|
| Wheat | CBOT Wheat ZW |
CBOT:ZW1! |
PEPPERSTONE:WHEAT |
CAPITALCOM:WHEAT |
| Corn | CBOT Corn ZC |
CBOT:ZC1! |
PEPPERSTONE:CORN |
CAPITALCOM:CORN |
| Soybeans | CBOT Soybeans ZS |
CBOT:ZS1! |
PEPPERSTONE:SOYBEANS |
CAPITALCOM:SOYBEAN |
| Soybean Meal | CBOT Meal ZM |
CBOT:ZM1! |
— (usually not offered) | CAPITALCOM:SOYBEANMEAL |
| Soybean Oil | CBOT Oil ZL |
CBOT:ZL1! |
— (usually not offered) | — (check availability) |
| Rough Rice | CBOT Rice ZR |
CBOT:ZR1! |
— | CAPITALCOM:RR |
| Cotton | ICE Cotton #2 CT |
ICEUS:CT1! |
PEPPERSTONE:COTTON |
CAPITALCOM:USCOTTON |
| Sugar | ICE Sugar #11 SB |
ICEUS:SB1! |
PEPPERSTONE:SUGAR |
CAPITALCOM:SB |
| Live Cattle | CME Live Cattle LE |
CME:LE1! |
PEPPERSTONE:CATTLE |
CAPITALCOM:LIVECATTLE |
| Feeder Cattle | CME Feeder GF |
CME:GF1! |
— | CAPITALCOM:FEEDERCATTLE |
| Lean Hogs | CME Hogs HE |
CME:HE1! |
— | CAPITALCOM:LEANHOGS |
Note: Availability can differ by jurisdiction and account settings. If a CFD ticker doesn’t resolve in TradingView, search your broker’s symbol list (some use different naming like “WHEATUSD” etc.).
Wheat — Bullish ▲
What changed (U.S.)
- Slightly larger U.S. supplies, but lower ending stocks.
- Exports increased (HRW + SRW), and season-average farm price raised.
Global angle
- World production up slightly, but global trade reduced.
- Global ending stocks lowered, with reductions across multiple exporters/importers.
Trading interpretation
Balance-sheet read is supportive: tighter stocks + higher implied price. If a seasonal long got shaken out on the release spike/reversal, consider a conditional re-entry rather than guessing the bottom:
- Re-entry trigger idea: reclaim the pre-WASDE range / prior day VWAP, or break a post-release swing high and hold.
- Risk control: invalidation below the post-release low (or ~1×ATR below trigger) to avoid “revenge re-entries”.
Trading Products: CBOT:ZW1! • PEPPERSTONE:WHEAT • CAPITALCOM:WHEAT
Coarse Grains (Corn focus) — Bullish ▲
What changed (U.S. Corn)
- Production lowered on reduced yield.
- Exports increased; ending stocks reduced.
- Season-average farm price raised.
Global angle
- Foreign production increased mainly in South America, but global trade reduced.
- Global ending stocks down, with notable reductions in key consumers.
Trading interpretation
- “Tightening corn” report: bullish on paper, but expect whipsaw first.
- Watch grain-complex correlation: corn strength can pull wheat/beans short-term.
Trading Products: CBOT:ZC1! • PEPPERSTONE:CORN • CAPITALCOM:CORN
Oilseeds (Soybeans focus) — Bearish ▼
What changed (U.S. Soybeans)
- Supplies increased on higher production.
- Biofuel use reduced; exports reduced; ending stocks raised.
- Season-average soybean price lowered.
Global angle
- World production increased (notably South America), crush increased, exports reduced.
- World ending stocks increased — broader headwind.
Trading interpretation
- Beans look heavier vs corn/wheat → consider relative-value views inside the complex.
- For seasonal longs: this adds headwind unless price action re-asserts trend.
Trading Products: CBOT:ZS1! • PEPPERSTONE:SOYBEANS • CAPITALCOM:SOYBEAN
Optional: CBOT:ZM1! / CAPITALCOM:SOYBEANMEAL
Rice — Mixed ▶
What changed (U.S.)
- Supply and total use roughly unchanged.
- Imports increased; exports reduced.
- Ending stocks increased; season-average farm price unchanged.
Global angle
- World production increased (notably India/Indonesia), consumption increased, ending stocks slightly lower.
Trading interpretation
Mixed signals (U.S. softer vs world slightly tighter). Prefer price confirmation (break/hold) over headline trades.
Trading Products: CBOT:ZR1! • CAPITALCOM:RR (Pepperstone typically n/a)
Cotton — Bullish ▲
What changed (U.S.)
- Production lowered on reduced yield.
- Exports increased; ending stocks reduced.
- Season-average farm price raised.
Global angle
- World production reduced; consumption slightly higher; ending stocks reduced.
Trading interpretation
- Supportive balance sheet; cotton can trend hard — size accordingly.
- CFD execution: respect ATR and avoid chasing first candle.
Trading Products: ICEUS:CT1! • PEPPERSTONE:COTTON • CAPITALCOM:USCOTTON
Sugar — Bullish ▲
What changed (U.S.)
- Total supply reduced (lower beginning stocks; Mexico imports down partly offset by higher imports elsewhere).
- Deliveries reduced; ending stocks reduced.
- Stocks-to-use ratio declines — supportive for price.
Global angle
- Mexico production reduced; exports reduced; ending stocks increased (Mexico flow still matters for U.S. imports).
Trading interpretation
- Net bullish from U.S. tightness perspective. Still expect macro/FX (BRL) influence and sharp intraday swings.
Trading Products: ICEUS:SB1! • PEPPERSTONE:SUGAR • CAPITALCOM:SB
Livestock, Poultry & Dairy — Bearish / Mixed
What changed
- Beef production increased; imports reduced; exports increased.
- Cattle prices lowered.
- Pork production slightly higher; hog prices lowered.
- Broiler production higher; broiler prices lowered; egg prices higher.
Trading Products: CME:LE1! / PEPPERSTONE:CATTLE / CAPITALCOM:LIVECATTLE
Optional: CME:GF1! / CAPITALCOM:FEEDERCATTLE • CME:HE1! / CAPITALCOM:LEANHOGS
What changed
- Milk production lowered (weaker cow numbers & milk per cow).
- Butter & cheese production increased; nonfat dry milk reduced; whey increased.
- Class III price raised; Class IV lowered.
Interpretation: two-speed dairy — cheese supportive (Class III up), while butter/NFDM pressure leans Class IV down.
Day-0 Execution Checklist (WASDE Day)
- Expect spikes: widen stops or reduce size if you trade the release window.
- Trade the confirmation: let the first impulse print, then take continuation/reclaim setups.
- Seasonals + WASDE: if stopped on release volatility, prefer rule-based re-entry (reclaim/breakout).
- Complex watch: corn bullish + soy bearish can create cleaner relative-value moves than outright.