WASDE (Feb 10, 2026) — Full Report Trading Bias (WASDE-668)
Focus: What changed vs. last month, why it matters, and a practical directional bias for the key tradable markets (Futures + CFD mapping for Pepperstone / Capital.com).
Headline Bias Board
How to Read This
- Bullish = net tighter supply / stronger demand / price support (WASDE logic).
- Bearish = looser balance sheet / weaker demand / price headwind.
- Mixed = conflicting drivers; wait for price confirmation.
Practical Trading Note
February is often a confirmation month rather than a “shock month”. If the balance-sheet changes are small, price may react first (knee-jerk) and only trend later if flows confirm. Use the grain-complex relative performance chart below to validate the narrative.
Trading Products & Symbol Mapping (Futures + CFDs)
Futures tickers below use the common TradingView continuous format (CBOT:ZC1! etc.). CFD symbols are what you’ll typically find directly in TradingView search for each broker (availability can vary by region/account).
| Market | Futures (CME/ICE) | TradingView Futures | Pepperstone (CFD) | Capital.com (CFD) |
|---|---|---|---|---|
| Wheat | CBOT Wheat ZW |
CBOT:ZW1! |
PEPPERSTONE:WHEAT |
CAPITALCOM:WHEAT |
| Corn | CBOT Corn ZC |
CBOT:ZC1! |
PEPPERSTONE:CORN |
CAPITALCOM:CORN |
| Soybeans | CBOT Soybeans ZS |
CBOT:ZS1! |
PEPPERSTONE:SOYBEANS |
CAPITALCOM:SOYBEAN |
| Soybean Meal | CBOT Meal ZM |
CBOT:ZM1! |
— (usually not offered) | CAPITALCOM:SOYBEANMEAL |
| Soybean Oil | CBOT Oil ZL |
CBOT:ZL1! |
— (usually not offered) | — (check availability) |
| Rough Rice | CBOT Rice ZR |
CBOT:ZR1! |
— | CAPITALCOM:RR |
| Cotton | ICE Cotton #2 CT |
ICEUS:CT1! |
PEPPERSTONE:COTTON |
CAPITALCOM:USCOTTON |
| Sugar | ICE Sugar #11 SB |
ICEUS:SB1! |
PEPPERSTONE:SUGAR |
CAPITALCOM:SB |
| Live Cattle | CME Live Cattle LE |
CME:LE1! |
PEPPERSTONE:CATTLE |
CAPITALCOM:LIVECATTLE |
| Feeder Cattle | CME Feeder GF |
CME:GF1! |
— | CAPITALCOM:FEEDERCATTLE |
| Lean Hogs | CME Hogs HE |
CME:HE1! |
— | CAPITALCOM:LEANHOGS |
Note: Availability can differ by jurisdiction and account settings. If a CFD ticker doesn’t resolve in TradingView, search your broker’s symbol list (some use different naming like “WHEATUSD” etc.).
January vs February — What Changed?
Quick month-over-month comparison for the core balance sheet items (Jan vs Feb columns inside WASDE-668 tables). This section is designed to be repeated every month throughout 2026.
Corn (ZC)
- Production (mbu): 17,021 → 17,021 flat
- Exports (mbu): 3,200 → 3,300 ▲ +100
- Ending Stocks (mbu): 2,227 → 2,127 ▼ −100
- Farm Price ($/bu): 4.10 → 4.10 flat
Soybeans (ZS)
- Production (mbu): 4,262 → 4,262 flat
- Exports (mbu): 1,575 → 1,575 flat
- Ending Stocks (mbu): 350 → 350 flat
- Farm Price ($/bu): 10.20 → 10.20 flat
Wheat (ZW)
- Production (mbu): 1,985 → 1,985 flat
- Exports (mbu): 900 → 900 flat
- Ending Stocks (mbu): 926 → 931 ▲ +5
- Farm Price ($/bu): 4.90 → 4.90 flat
Trader takeaway: February is a “small revision” month — Corn is the clean standout (exports up + ending stocks down), while Soybeans are unchanged and Wheat is slightly looser on ending stocks. Use confirmation via price/relative strength rather than trading headlines.
Post-WASDE Confirmation — Grain Complex Relative Performance
The chart below compares the percentage performance of Corn, Soybeans and Wheat around the February WASDE release. This is the fastest way to validate whether the balance-sheet narrative translates into real flows.
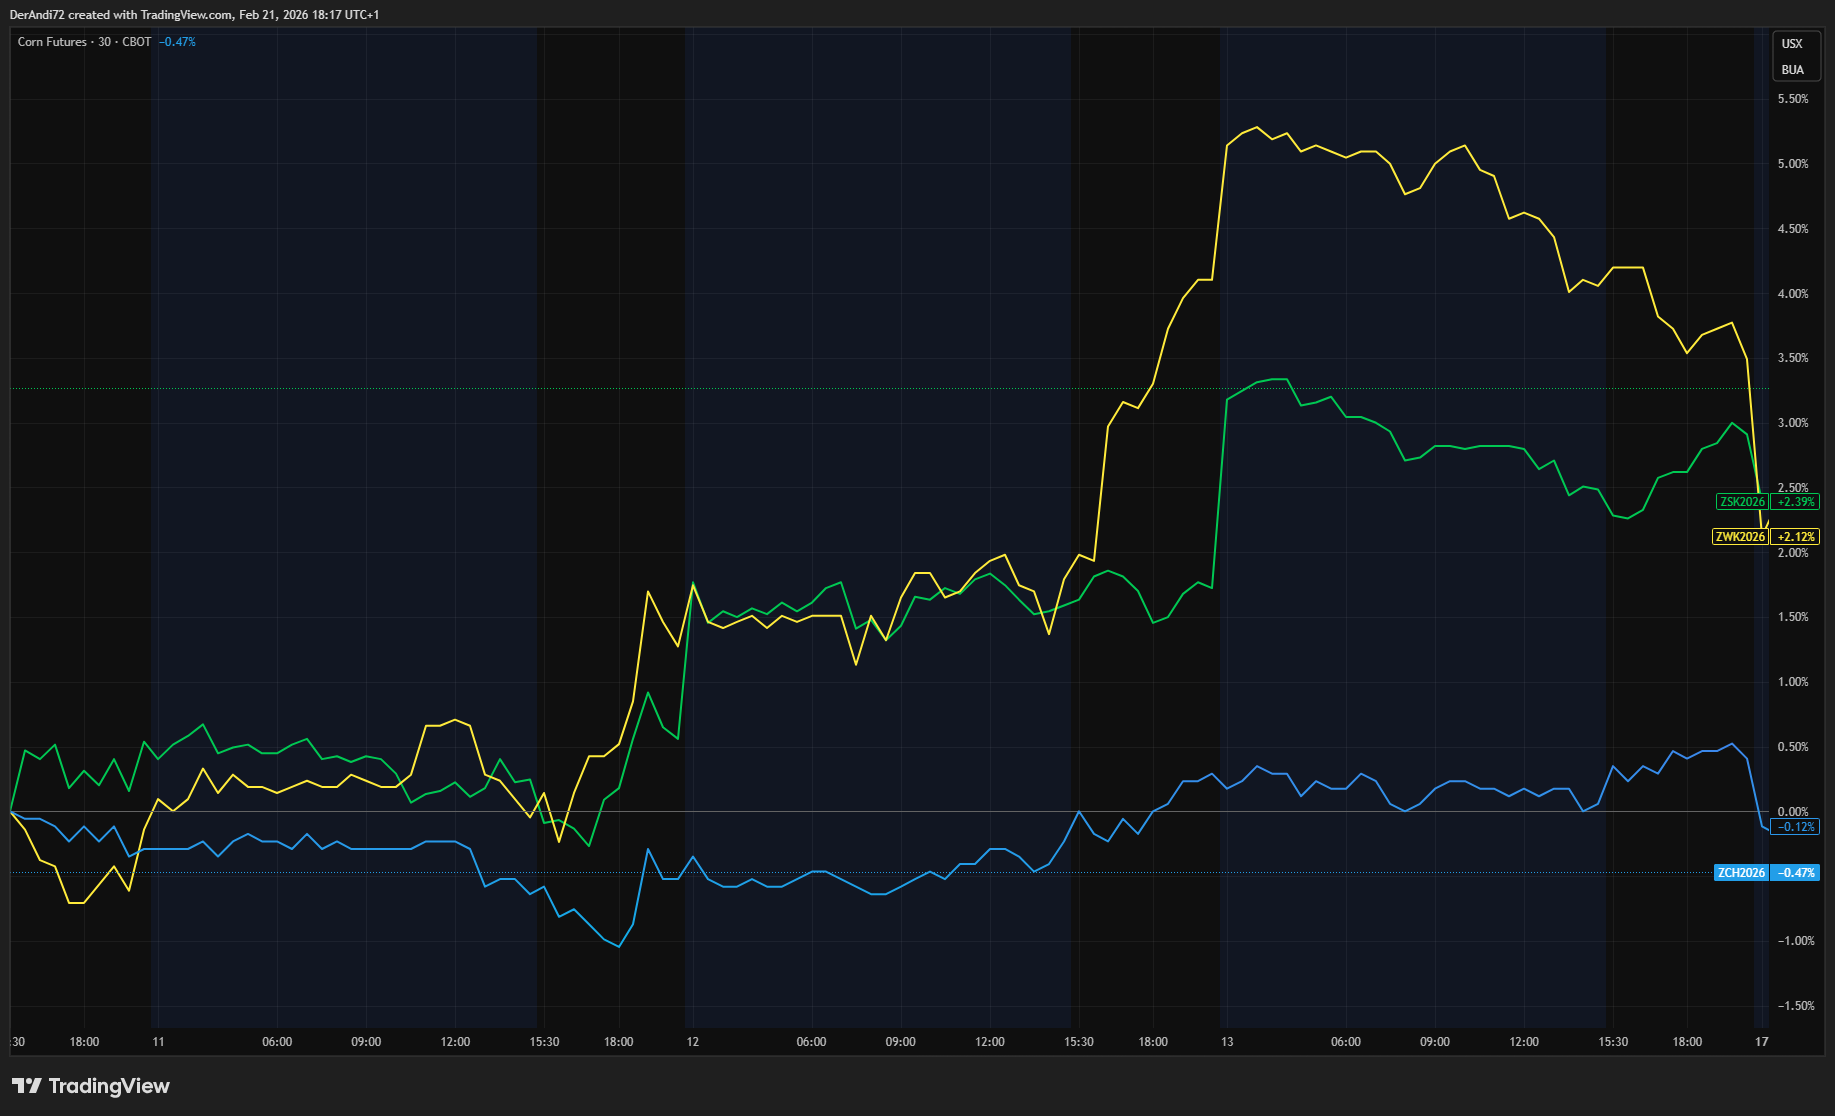
- Corn outperformance = tightening confirmed (exports up, stocks down).
- Soybeans drifting/lagging = “unchanged WASDE” market waits for South America + demand signals.
- Wheat stability = neutral balance sheet; price tends to trade correlation & risk headlines.
Wheat — Neutral ▶
What changed (U.S.)
- Ending stocks: 926 → 931 mbu (slightly higher)
- Exports: 900 mbu (unchanged)
- Domestic use: 1,133 → 1,128 mbu (slightly lower)
- Farm price: $4.90/bu (unchanged)
Trading interpretation
February is not adding new conviction to Wheat. With exports flat and ending stocks slightly higher, Wheat often trades off complex correlation (Corn) and risk headlines rather than WASDE itself. Prefer price confirmation (break/hold) over “report guessing”.
Trading Products: CBOT:ZW1! • PEPPERSTONE:WHEAT • CAPITALCOM:WHEAT
Corn — Bullish ▲
What changed (U.S.)
- Production: 17,021 mbu (unchanged)
- Exports: 3,200 → 3,300 mbu
- Ending stocks: 2,227 → 2,127 mbu
- Farm price: $4.10/bu (unchanged)
Trading interpretation
- This is a clean “tightening” revision: higher exports + lower ending stocks.
- Don’t chase the first candle — best entries often come from reclaim/continuation after the initial spike.
- Risk control idea: invalidation below the WASDE-day low or ~1×ATR below the trigger.
Trading Products: CBOT:ZC1! • PEPPERSTONE:CORN • CAPITALCOM:CORN
Soybeans — Mixed ▶
What changed (U.S.)
- Production: 4,262 mbu (unchanged)
- Exports: 1,575 mbu (unchanged)
- Ending stocks: 350 mbu (unchanged)
- Farm price: $10.20/bu (unchanged)
Trading interpretation
When WASDE is “unchanged”, Soybeans often trade more off South America weather/harvest, export pace, and meal/oil dynamics. In that environment, the higher-quality trade is frequently relative-value inside the grain complex (e.g., Corn strength vs Beans).
Trading Products: CBOT:ZS1! • PEPPERSTONE:SOYBEANS • CAPITALCOM:SOYBEAN
Optional: CBOT:ZM1! / CAPITALCOM:SOYBEANMEAL
Rice — Bearish ▼
What changed (U.S.)
- Imports: 48.7 → 47.7 million cwt (−1.0)
- Exports: 89.0 → 87.0 million cwt (−2.0)
- Ending stocks: 49.3 → 50.3 million cwt (+1.0)
- Farm price: $11.80 → $12.10/cwt (+0.30)
Trading interpretation
Softer exports and higher ending stocks are a balance-sheet headwind. Rice can be thinner/liquidity-sensitive — treat it as a “planning market” unless you have a clear technical trigger.
Trading Products: CBOT:ZR1! • CAPITALCOM:RR (Pepperstone typically n/a)
Cotton — Bearish ▼
What changed (U.S.)
- Exports (million bales): 12.20 → 12.00 (−0.20)
- Ending stocks (million bales): 4.20 → 4.40 (+0.20)
- Upland farm price: 61.0 → 60.0 cents/lb (−1)
- Production: 13.92 million bales (unchanged)
Trading interpretation
A classic “demand softness” revision: exports trimmed, stocks rise, price forecast slips. Cotton can trend hard — avoid chasing the first move and respect ATR sizing.
Trading Products: ICEUS:CT1! • PEPPERSTONE:COTTON • CAPITALCOM:USCOTTON
Sugar — Mixed ▶
What changed (U.S.)
- Production (1,000 STRV): 9,381 → 9,410 (+29)
- Imports (1,000 STRV): 2,255 → 2,243 (−12)
- Ending stocks (1,000 STRV): 1,922 → 1,940 (+18)
- Stocks-to-use: 15.8% → 15.9% (slightly looser)
Trading interpretation
The U.S. balance sheet is still relatively tight, but February is marginally looser (ending stocks up). Sugar is heavily influenced by macro and FX (especially BRL) — treat WASDE as one input, not the whole story.
Trading Products: ICEUS:SB1! • PEPPERSTONE:SUGAR • CAPITALCOM:SB
Livestock & Dairy — Supply Up / Prices Up (Two-Speed)
What changed (2026)
- Beef production: 25,802 → 25,987 million lbs (higher)
- Pork production: 28,229 → 28,289 million lbs (higher)
- Total red meat production: 54,198 → 54,444 million lbs (higher)
More supply is generally a headwind unless demand surprises. In practice, cattle/hogs can still trend, but WASDE revisions point to a “supply up” backdrop.
Trading Products: CME:LE1! / PEPPERSTONE:CATTLE / CAPITALCOM:LIVECATTLE
Optional: CME:GF1! / CAPITALCOM:FEEDERCATTLE • CME:HE1! / CAPITALCOM:LEANHOGS
What changed (2026 prices)
- All Milk price: $18.25 → $18.95/cwt (raised)
- Class III: $16.35 → $16.65/cwt (raised)
- Class IV: $14.45 → $15.70/cwt (raised)
This is price-supportive for the dairy complex: product prices and class prices revised higher. If you trade dairy proxies, treat this as a constructive macro tailwind.
Day-0 Execution Checklist (WASDE Day)
- Expect spikes: reduce size or widen stops if you trade the release window.
- Trade confirmation: let the first impulse print, then take continuation/reclaim setups.
- Use the complex: Corn vs Beans often gives cleaner relative-value signals than outright.
- Re-entry rule: if stopped by volatility, prefer a rule-based trigger (reclaim range / break & hold).