How Seasonality Shapes Commodity Markets
Seasonal patterns with Wheat and Corn examples
1. Why Seasonality Matters
Unlike equities, most commodities are bound to natural cycles: planting, growing, harvesting, and consumption. These cycles create recurring price tendencies that traders can study and incorporate into a rules-based framework for timing, risk, and position sizing.
2. The Logic Behind Seasonality
- Agricultural calendars: Planting, emergence, pollination, harvest — each phase shifts supply expectations and risk premia.
- Weather & logistics: Drought, floods, or river levels can tighten supply or delay exports, often at recurring times of year.
- Consumption cycles: Energy (heating vs. driving seasons), feed demand, and fiscal-year inventory management.
- Behavioral patterns: Producers and commercials hedge at typical times, creating repeatable flows visible in positioning data.
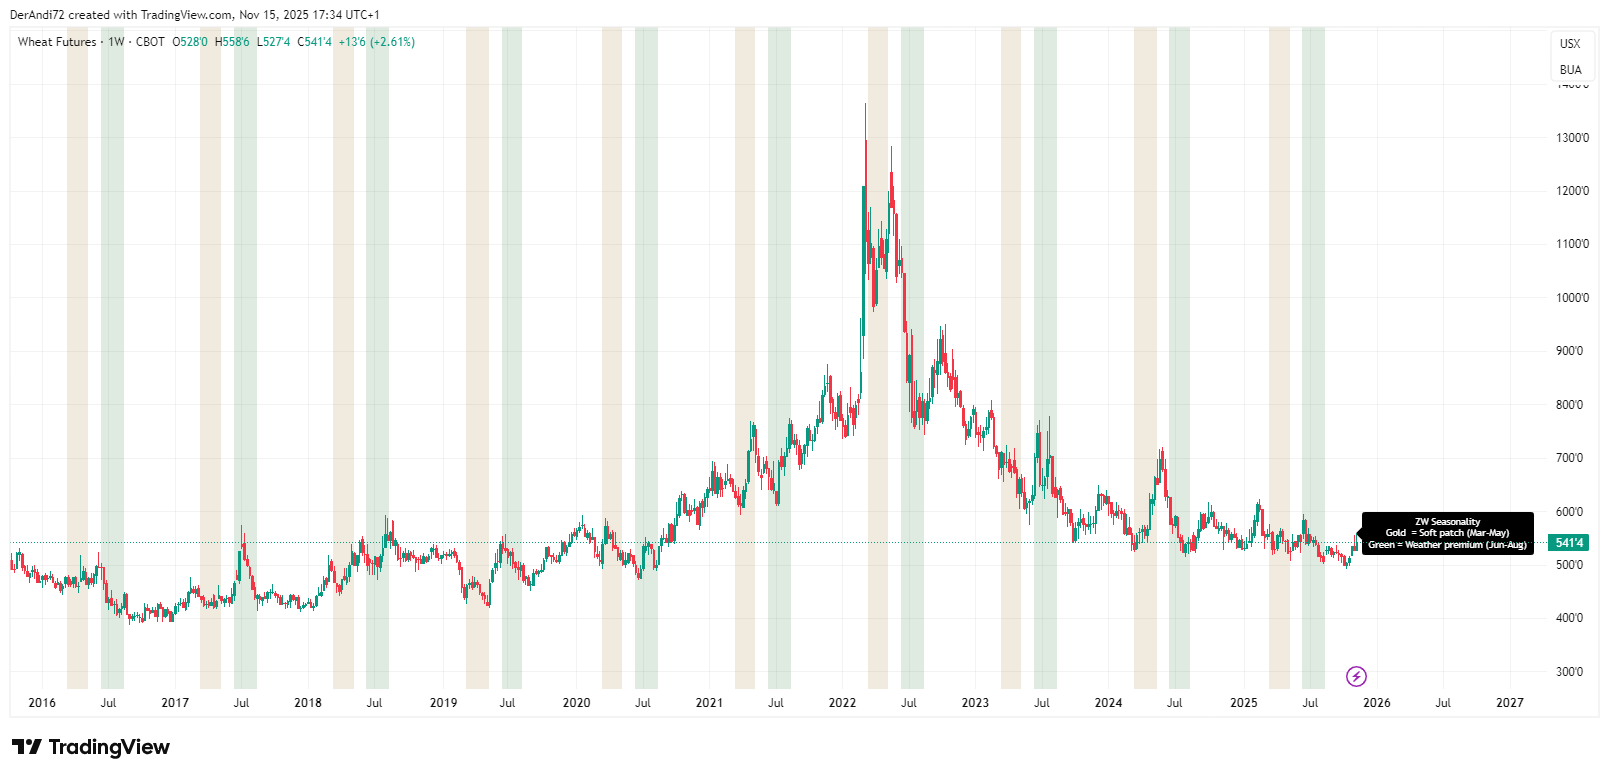
3. Wheat (ZW) — Seasonal Tendencies
In the Northern Hemisphere, wheat often weakens into the planting window (roughly March–May) as expected supply rises, then rebuilds a weather premium into early summer when yield risk is most uncertain.
Typical Windows
- Soft patch: ~March → early May (planting progress, supply expectations)
- Weather premium: ~June → August (yield uncertainty into harvest)
How to Trade It
- Look for commercial hedgers reducing net shorts near seasonal lows (COT context).
- Use time-based windows for bias, but trigger entries via breakout/VWAP confirmation.
- Manage risk with ATR-based stops; consider time exits (e.g., T+3/T+10 bars or to end of window).
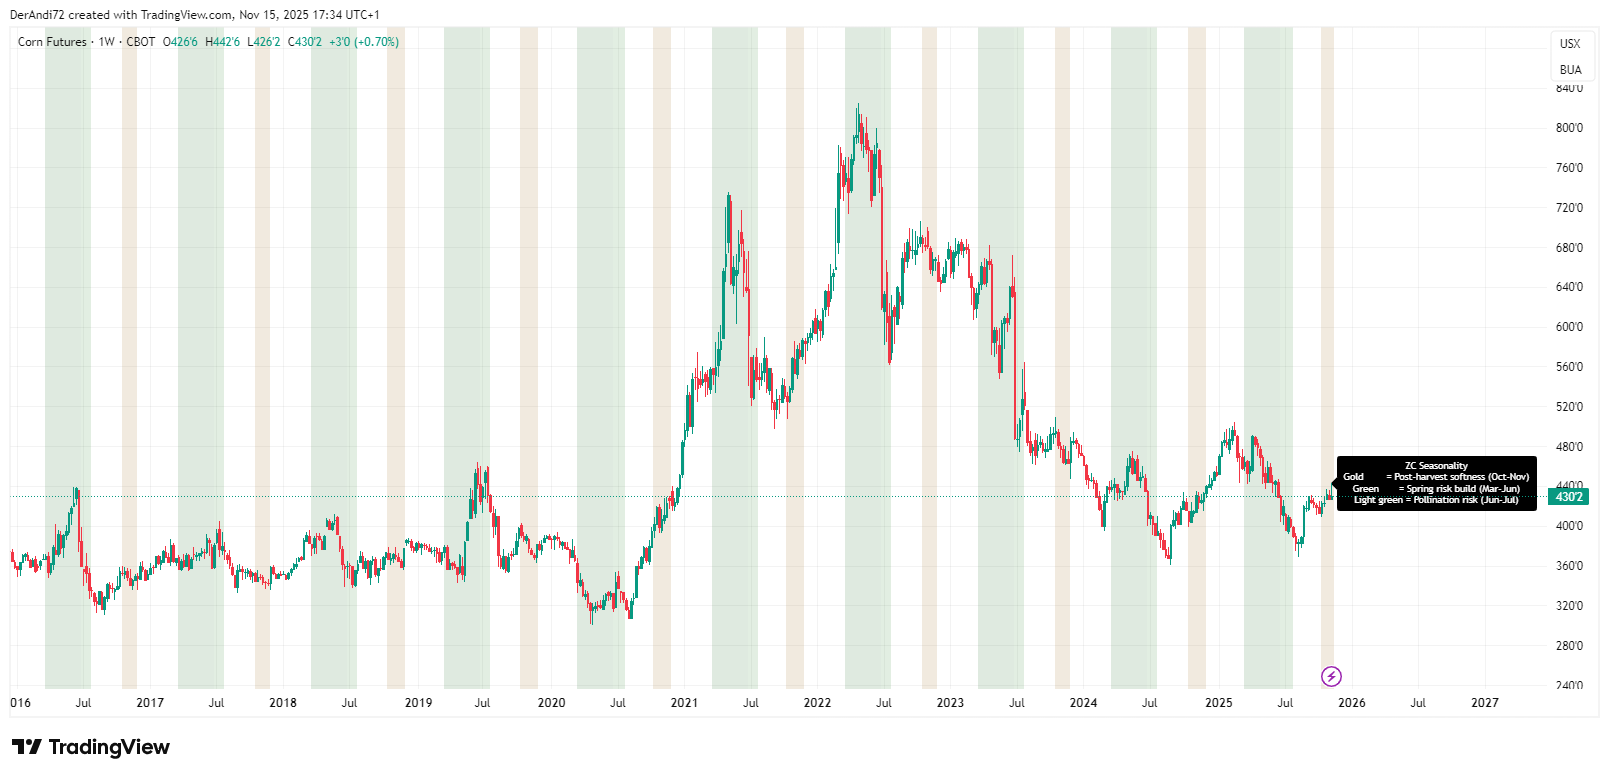
4. Corn (ZC) — Seasonal Tendencies
Corn frequently softens after harvest (Oct–Nov) as supply hits the pipeline, then rebuilds risk premia into spring and early summer, especially around planting and pollination.
Typical Windows
- Post-harvest softness: ~October → November
- Spring risk build: ~March → June (planting/weather)
- Pollination risk: ~June → July (heat/drought sensitivity)
How to Trade It
- Align with COT: commercials turning less net short can support seasonal longs.
- Layer event risk: WASDE, Crop Progress, export sales; size down ahead of reports.
- Trigger with price action: range breakouts, VWAP reclaim, or momentum upturns.
5. Integrating Seasonality, COT & WASDE
Checklist
- Seasonal bias: Identify the current window (bearish/bullish/neutral) from your seasonal study.
- Positioning: Review COT (commercials, managed money) for confirmation or divergence.
- Fundamentals: Map upcoming catalysts (WASDE date, Crop Progress, export sales, weather).
- Trigger & timing: Define technical conditions (breakout, VWAP reclaim, momentum cross).
- Risk model: ATR stop, fixed R multiple, trade cap per day, and a time-based exit.
- Post-trade review: Journal the R-multiple, slippage, and seasonality vs. reality delta.
6. Strategy Template (Entry, Risk, Exit)
Example Rules (for illustration)
- Bias: Long only in the seasonal bullish window; flat or short in soft windows.
- Entry: Session breakout above prior day high and price above daily VWAP.
- Stop: 1.5–2.0 × ATR(14) or technical swing low/high; hard stop required.
- Exit: Take partials at 1R/2R; final exit time-based (e.g., end of seasonal window or T+N bars).
- Filters: Avoid entries within N minutes of high-impact reports (WASDE, EIA, etc.).
- Sizing: Cap exposure per symbol; avoid overlapping correlated positions.
Note: Adapt to your instrument (Futures vs. CFDs) and trading hours (e.g., 14:29–21:59 Europe/Berlin for U.S. index sessions).
7. Limitations & Risk Notes
Seasonality ≠ certainty. Weather shocks (e.g., El Niño/La Niña), geopolitics, logistics, and policy changes can override historical tendencies. Always combine seasonal context with real-time data and prudent risk controls.
- Backtests can be biased by contract rolls and delivery month selection — standardize your futures chain.
- Liquidity and tick size differ across venues and months; test slippage assumptions conservatively.
- CFD substitutes can diverge from front-month futures due to provider pricing — validate your mapping.